Sunday, March 29, 2015

Week 11 summary
Alright, so, I tried to follow along, but hit a road block with the codding. I’m really not sure where I went wrong as I copied and pasted straight from the blog.


Here is what I did gather about predictive analytics from the module and the blog. First off, it’s not easy. I am not sure if this would be true for all data or if this was particular to the stock market or just Apple stock in particular. I recall reading in the book “The Ascent of Money” by Niall Ferguson, about how a few people came up with a logarithm to crack the stock market. It worked…until it didn’t. That is to say that it worked for a while, only to have it fail as spectacularly as it once succeeded. Perhaps this is a testament to the limitations of predictive analytics; whether that is a permanent or temporary situation. Let’s say it was temporary. What then? What happens when the stock market gets cracked? This is an interesting thing to ponder. What happens when a system that is to such a high degree reactionary, gets predictable? Do we end up with one of those unstoppable forces V. the unmovable object scenarios? This isn’t a topic that has been discussed yet in any of my courses and perhaps I am getting ahead of myself, but I can’t help but wonder – how predictive can analytics get? And in situations where the prediction can affect the predicted; is that a bad thing?
Alight, back on task, here. The process by which the Apple stock was attempted to be predicted seemed pretty solid to me. Step one, gather the data. This part seems pretty straight forward and relatively easy as stock market data is regularly tracked and recorded. Once gathered, the data was narrowed down. This seems reasonable as the less data one has, the easier it is to work with. Choosing other stocks that seem to correlate with Apple, does not strike me as the plan though, as this can only be historical and could not account for future goings on. Furthermore, I one is going to go this route- why not just use the beta value, as this is common stat that can be obtained without any further analysis. The method of clustering did not yield stellar results. Perhaps this had to do with the lack of for cite when choosing the other stocks to cluster it with. The Linear Models also did not yield good results, as did the support vectors, and the classification trees. This all makes me wonder about what type of data is even the right type of data to yield productive analytics and what data should not even be attempted to be analyzed predictively. Perhaps that will be covered in the next class.
Sunday, March 22, 2015

T.test in R


When comparing two sets of data; it is important to first know if the two sets are significantly different from one another. Fore, if they are not, there is no real point in comparing them. This is where a T test comes in. A T test will provide a hypothesis, such as - the means of the two data sets are different; and then test that hypothesis.
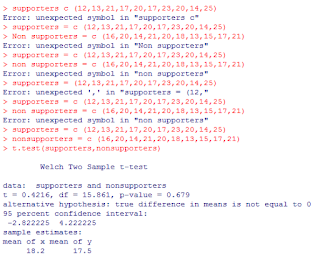
Upon assignment I preformed a T test with the following two data sets:
> supporters = c(12,13,21,17,20,17,23,20,14,25)
> Non supporters = c(16,20,14,21,20,18,13,15,17,21).
These sets represent samples of a population of 150,000 and their opinions about support for a congressman's idea regarding libraries.
The importance here is not the particular data, but the process by which it can be analyzed using R.
As the results below show, R can be used to run a T test by entering the data sets and then typing "t.test" and hitting enter. As the screen shot shows, it is important to not leave a space when you data set name has more than one word in it.


Thursday, March 12, 2015

Summary of Characteristics and Attributes of machine leaning

I have to disagree with Mr. Kobielus’s analogy of log data to dark matter. Despite the 3 V’s of log data in the world today being beyond the scope of human comprehension – with machine learning, log data becomes palatable, whereas, dark matter is incomprehensible despite our best technological efforts to quantify it. This is not to say that on face value, both are not equally mysterious. Much like the mysteries of the cosmos, predictive data lost in a sea of data seems illusory to the human eye.
Despite the short coming of the human ability; it has provided the tools with which we can corral this seemingly infinite data. By way of algorithms, computers can not only detect important data sets missed by human eye, but it can also learn to become more proficient and finding those sets. Perhaps the best way to go about this process is unsupervised learning. This is the process by which a computer will cluster, compress and summarize data, so that a human mind can begin to comprehend it.

Despite the cold and unhuman sound of the name “machine learning”; Hanna Wallach outlines how it can provide some very human results. She also, attempts to clarify what exactly big data is. For example: how does big data as we know it differ from large amounts of data that would come from the field of partial physics? Hanna sources a few quotes for the definition of big data – the best of which is – the amassing of huge amounts of statistical information on social and economic trends and human behavior. In other words, as she states “unlike data sets arising in physics, the data sets that typically fall under the big data umbrella are about people…”. I think this is the crux of big data and many people may miss this.

One way that machine learning can in some ways be more human than human; is in now it can find smaller subsets within large amounts of data. For example: minority members of populations might not be well represented in a set, but people are still interested in learning what their statistics have to tell us. Machine learning can drill down into the data to discover and analyze these small sets for that purpose. Whereas, a human eye or even recent technologies would find it difficult to sift through to find the data that represents minorities. Hanna describes this process as granulizing the data – meaning that it is looked upon from a micro, as well as, a macro level.
The overarching theme of Hanna message is that in order to provide real improvement to our society via data mining; social sciences will need to be combined with computer science. And prioritizing social questions over data availability. She suggests a question driven approach, instead of working inductive or deductively from the data itself. She feels that this is the best way to avoid missing information of small granular size.
Perhaps the best models for obtaining the goal of social improvement through data mining are exploratory and explanatory ones. It is through these models, that the typical model of prediction can be achieved; when dealing with highly granulated data such as that of minorities in a large population. Unfortunately, human biases will play into these as well.
Another important aspect of Hanna’s message is that of the uncertainty that comes with the minorities of a data set. She feels that uncertainty should be expressed in order to properly account for those smaller data sets within a large one. Luckily many machine learning methods do just that.